John Carlo Maula

Data Analyst
I graduated from The Ohio State University with a Bachelors in Data Analytics. I also minored in Mathematics and Epidemiology.
My hobbies include listening to music, baking desserts, and playing video games.
Analyzing The Spotify Features of Taylor Swift’s Music
Project Description: In this project, I retrieved Spotify features of Taylor Swift’s music using the Spotipy library and visualized them for analysis. I also developed a web app that compares the features of her re-recorded music with the original.
Taylor Swift is my most listened to artist, so I thought it would be fun to see the musical features of her music. For the most part, I can easily tell which of her songs are upbeat/danceable and which ones are slow/acoustic. It would be interesting to quantify these features and see how her albums differ from each other and see the progression in her music.
I am also interested in comparing her re-recordings with the original to see if there are any differences in the features. As of now, only the re-recordings for Fearless and Red have been released.
Note: Updated on 02/05/2023 to include her new album, Midnights.
Spotify Features
For this section, I will only be focusing on Swift’s 10 studio albums released throughout 2006 - 2022. This means that I will not be including any EPs, stand-alone singles, or re-recordings (known as “Taylor’s Version”). I will be including bonus tracks from deluxe versions, but alternative versions of standard songs will be excluded (e.g. piano or acoustic versions). This adds up to a total of 171 songs.
For a complete definition of the Spotify features, you can visit the Spotify API here. To see the code used to produce the plots below, you can view them on my Github here.
Length
Song length is the duration of the track in minutes.
The distribution of length appears to be right-skewed with an average length of ~3 minutes and 54 seconds. Due to her storytelling style of songwriting, her songs tend to have a longer length. As she transitioned to pop music with 1989, the overall length of her music began to decrease. Her albums folklore and evermore saw a return in her storytelling form, which resulted in longer songs. Her return to the pop genre with Midnights saw another decrease in overall song length.
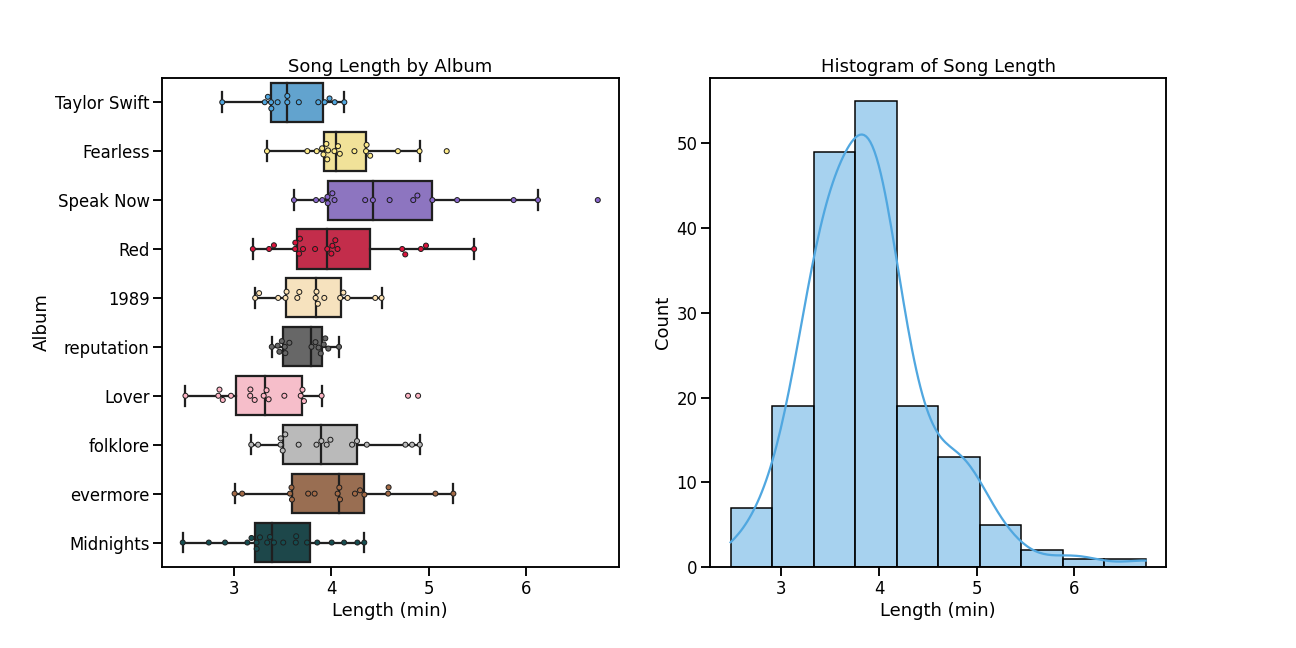
Her top 3 longest songs are all from her album Speak Now:
- Dear John (6:43)
- Last Kiss (6:07)
- Enchanted (5:52)
Her top 3 shortest songs are from Midnights and Lover:
- Glitch (2:28)
- It’s Nice To Have A Friend (2:30)
- Vigilante Shit (2:28)
Although not included in here, her longest song is All Too Well (10 Minute Version) from Red (Taylor’s Version), clocking in at 10:13.
Popularity
The popularity of a track is a value between 0 and 100, with 100 being the most popular. The popularity is calculated by algorithm and is based, in the most part, on the total number of plays the track has had and how recent those plays are.
As of February 5, 2023, her most popular albums are reputation, Lover, and Midnights. As these are pop albums that have been promoted heavily, it makes sense that they are still popular among the general population. Her least popular albums are Fearless and Red due to the re-recordings of these albums being released. TikTok can also have a significant influence on a song’s popularity.
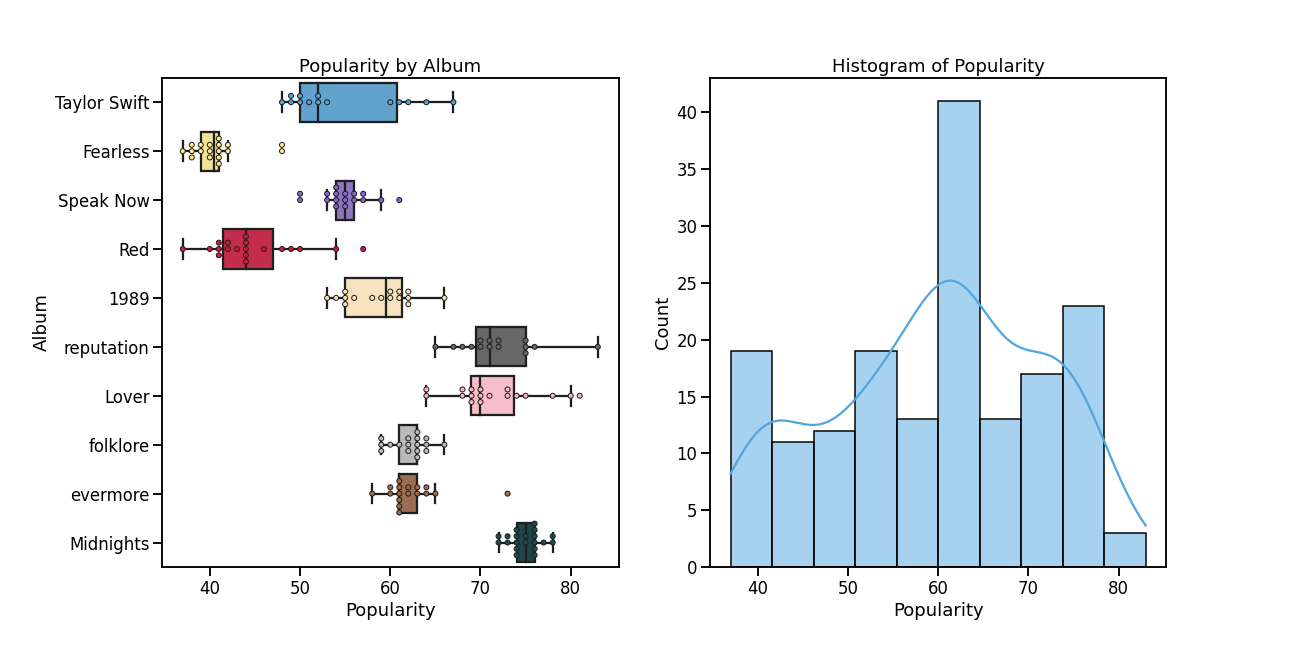
As of now, her most popular songs on Spotify are:
- Don’t Blame Me
- Lover
- Cruel Summer
- Would’ve, Could’ve, Should’ve
- Paper Rings
Danceability
Danceability describes how suitable a track is for dancing based on a combination of musical elements including tempo, rhythm stability, beat strength, and overall regularity. A value of 0.0 is least danceable and 1.0 is most danceable.
The distribution of danceability is unimodal and symmetric with a mean of 0.59 and standard deviation of 0.12. Her albums tended to become to become more danceable until folklore, where overall danceability began to decrease. Her return to pop with Midnights shows an increase in danceability.
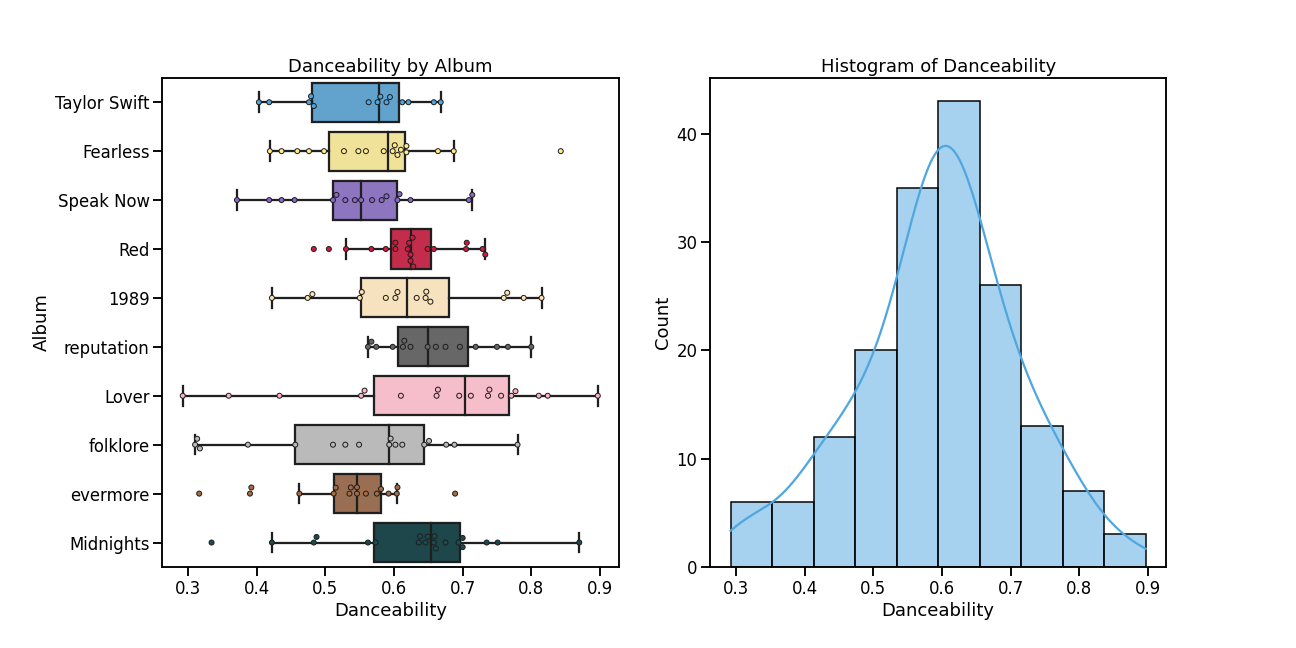
Her top 3 most danceable songs are:
- I Think He Knows (0.90)
- Vigilante Shit (0.87)
- Hey Stephen (0.84)
Her top 3 least danceable songs are:
- The Archer (0.29)
- exile (0.31)
- the lakes (0.31)
Interestingly, her most danceable and least danceable songs are from Lover and are right next to each other in the tracklist.
Acousticness
Acousticness is a confidence measure from 0.0 to 1.0 of whether the track is acoustic. 1.0 represents high confidence the track is acoustic.
The distribution of acousticness is strongly right-skewed with a median of 0.17 and a mean of 0.33. Her albums are generally not acoustic with the exception of a few songs. However, folklore and evermore have an overall high acousticness due to the alternative genre of these albums.
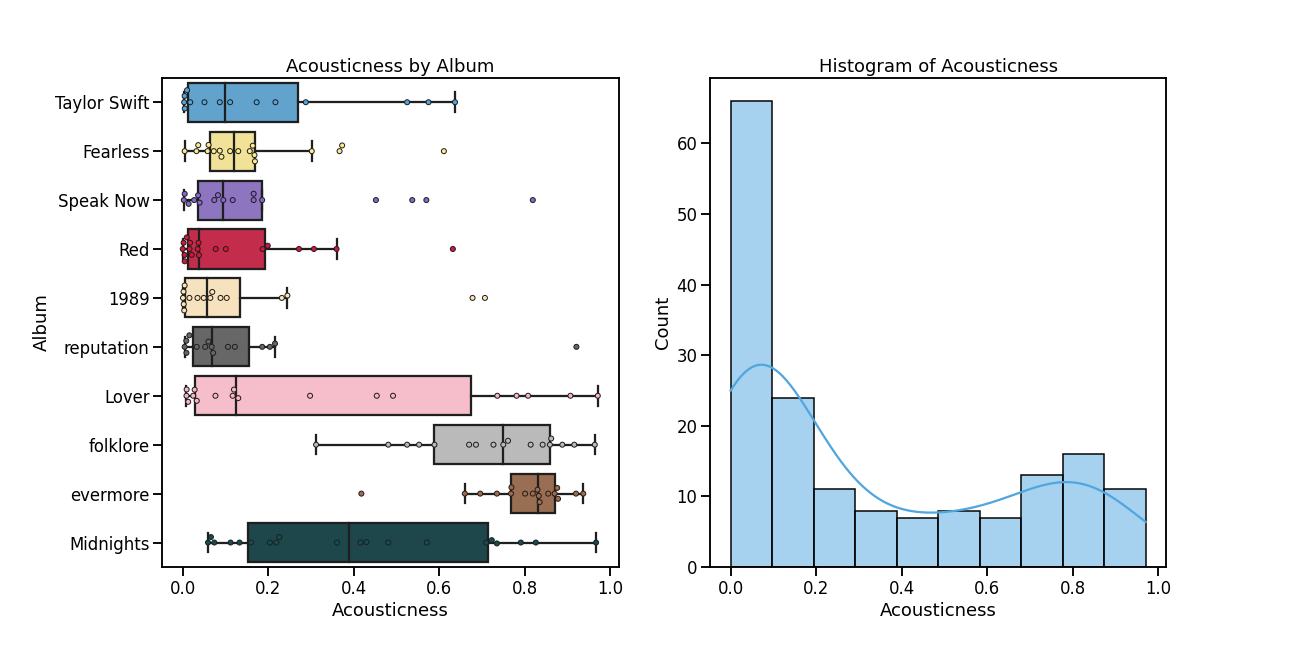
Her top 3 most acoustic songs are:
- It’s Nice To Have A Friend (0.97)
- Sweet Nothing (0.97)
- hoax (0.96)
Many of her songs have an acousticness of 0.
Energy
Energy is a measure from 0.0 to 1.0 and represents a perceptual measure of intensity and activity. Typically, energetic tracks feel fast, loud, and noisy.
The distribution of energy is unimodal and slightly symmetric with a mean of 0.57. The overall energy of her albums tend to stay around the range of 0.60 - 0.70. However, there is a decreasing trend in energy starting with reputation with folklore having the lowest overall energy.
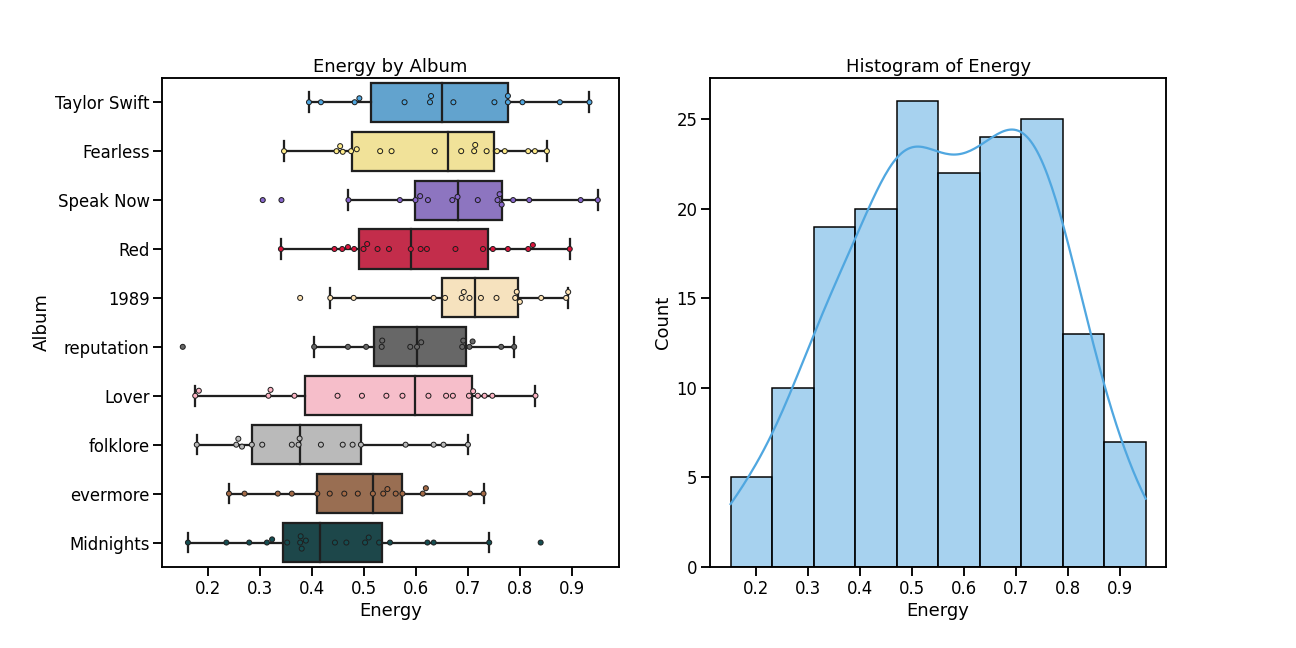
Her top 3 songs with the most energy are:
- Haunted (0.95)
- I’m Only Me When I’m With You (0.93)
- Better Than Revenge (0.92)
Her top 3 songs with the least energy are:
- New Year’s Day (0.15)
- Sweet Nothing (0.16)
- It’s Nice To Have A Friend (0.17)
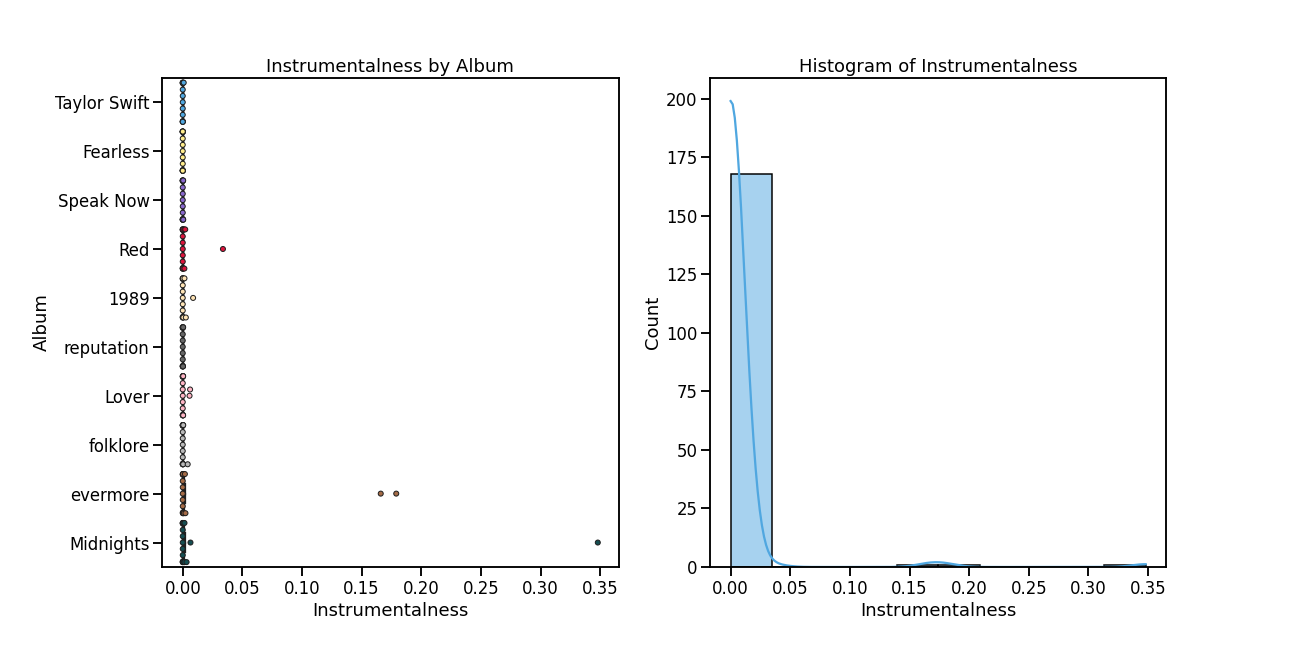
Instrumentalness
Instrumentalness predicts whether a track contains no vocals. “Ooh” and “aah” sounds are treated as instrumental while rap or spoken word tracks are vocal. The closer the instrumentalness value is to 1.0, the greater likelihood the track contains no vocal content.
Almost all of Taylor’s songs have an instrumentalness of 0. The songs with the highest instrumentalness are Labyrinth (0.35), long story short (0.18) and gold rush (0.17), which are from her most recent albums, Midnights and evermore.
Liveness
Liveness detects the presence of an audience in the recording. Higher liveness values represent an increased probability that the track was performed live.
The distribution of liveness is strongly right-skewed with a median of 0.12. Her albums generally have low liveness with a few outliers. There appears to be a decreasing trend in the variability of liveness which could be attributed to the recording process now versus back then.
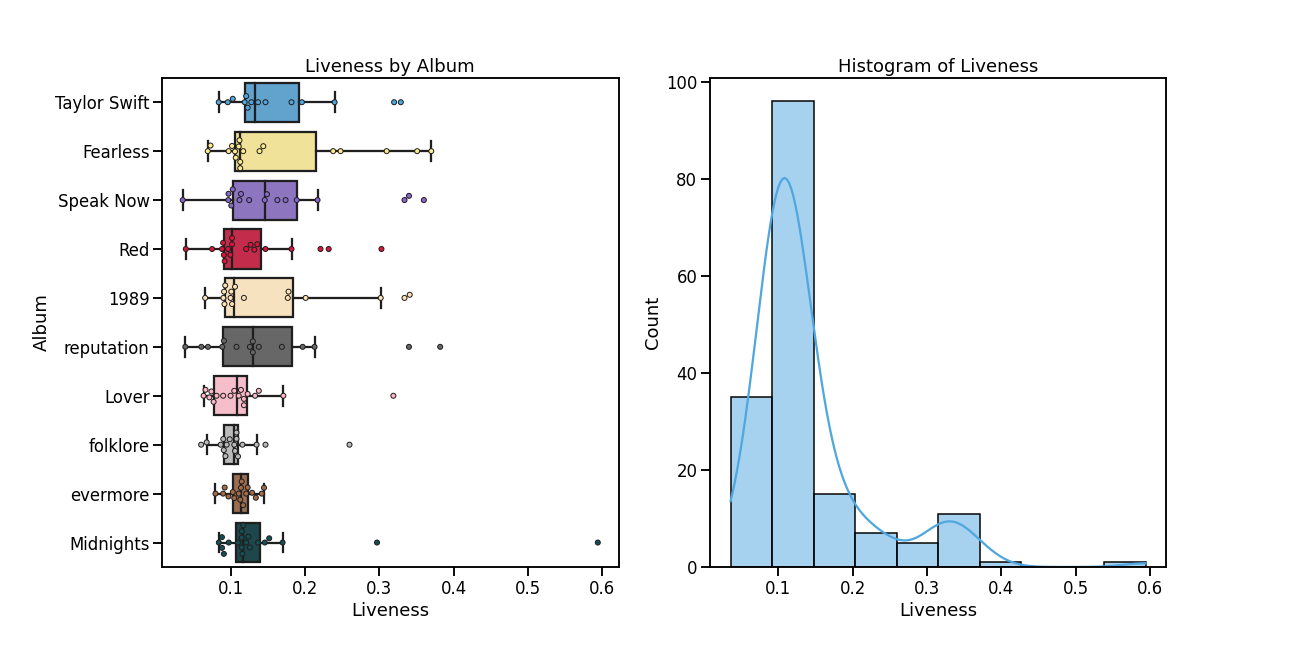
The top 3 songs with the highest liveness are:
- Karma (0.59)
- This Is Why We Can’t Have Nice Things (0.38)
- Tell Me Why (0.37)
The bottom 3 songs all have a liveness of 0.04:
- The Story Of Us
- King Of My Heart
- I Knew You Were Trouble
Loudness
The overall loudness of a track in decibels (dB). Loudness values are averaged across the entire track and are useful for comparing relative loudness of tracks. Values typically range between -60 and 0 db.
The distribution of loudness is left-skewed with a mean of -7.55 dB and a median of -6.94 dB. There appears to be an overall decreasing trend in loudness with her albums.
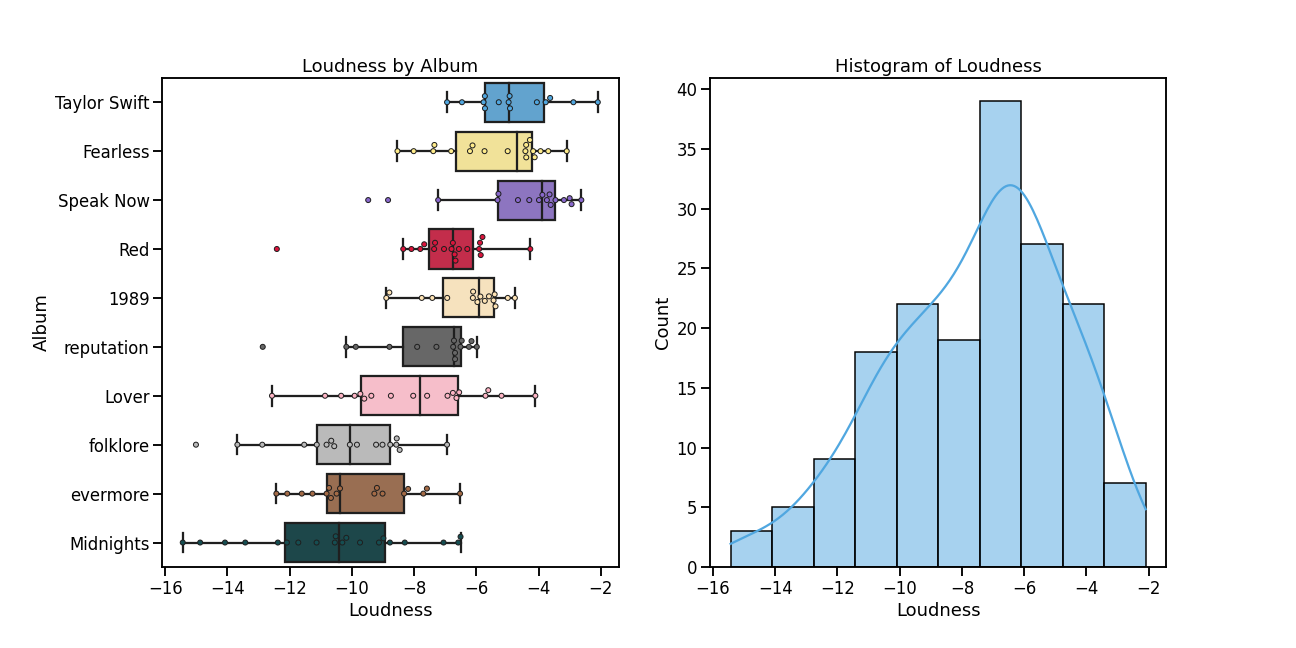
Her top 3 songs with the highest loudness are:
- Picture To Burn (-2.10)
- Haunted (-2.63)
- A Place In This World (-2.88)
Her top 3 songs with the lowest loudness are:
- Labyrinth (-15.43)
- hoax (-15.01)
- Sweet Nothing (-14.88)
Speechiness
Speechiness detects the presence of spoken words in a track. The more exclusively speech-like the recording (e.g. talk show, audio book, poetry), the closer to 1.0 the attribute value.
Similar to instrumentalness, the distribution of speechiness is extremely left-skewed. The album reputation tends to have an overall higher speechiness compared to the other albums followed by Midnights.
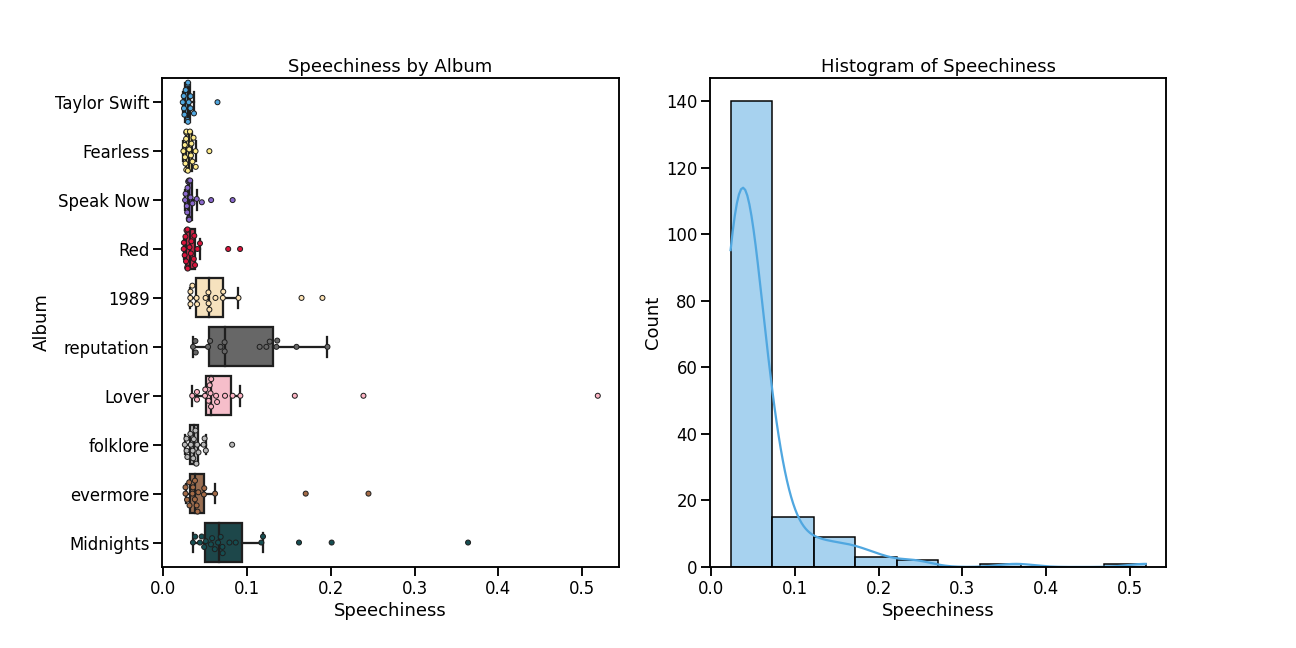
Her songs with the highest speechiness are:
- I Forgot That You Existed (0.52)
- Vigilante Shit (0.36)
- closure (0.24)
- False God (0.24)
Many of her songs have a speechiness between 0 and 0.1, with 0.02 being the minimum.
Tempo
The overall estimated tempo of a track in beats per minute (BPM). In musical terminology, tempo is the speed or pace of a given piece and derives directly from the average beat duration.
The distribution of tempo is unimodal and fairly symmetric with an average of 123.0 bpm and a standard deviation of 31.1 bpm. All her albums tend to be distributed around the overall mean. However, the overall tempo for Red, Lover, and Midnights is slightly lower while the overall tempo for Speak Now is slightly higher.
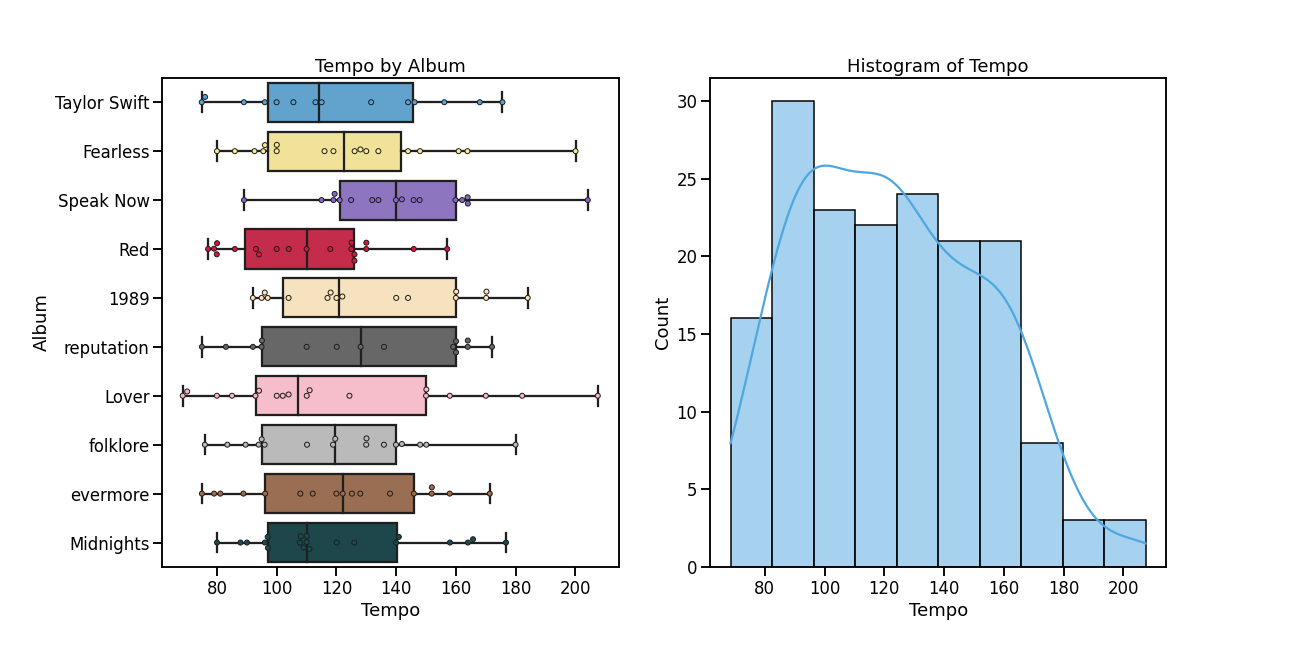
Her top 3 songs with the highest tempo are:
- Soon You’ll Get Better (207.48)
- Long Live (204.12)
- Untouchable (200.02)
Her top 3 songs with the lowest tempo are:
- Lover (68.53)
- It’s Nice To Have A Friend (70.01)
- Mary’s Song (Oh My My My) (74.90)
Just like danceability, the songs with the highest and lowest tempo appear in the same album, Lover. It’s interesting that the song Soon You’ll Get Better has the highest tempo considering that it is a depressing, emotional, acoustic song.
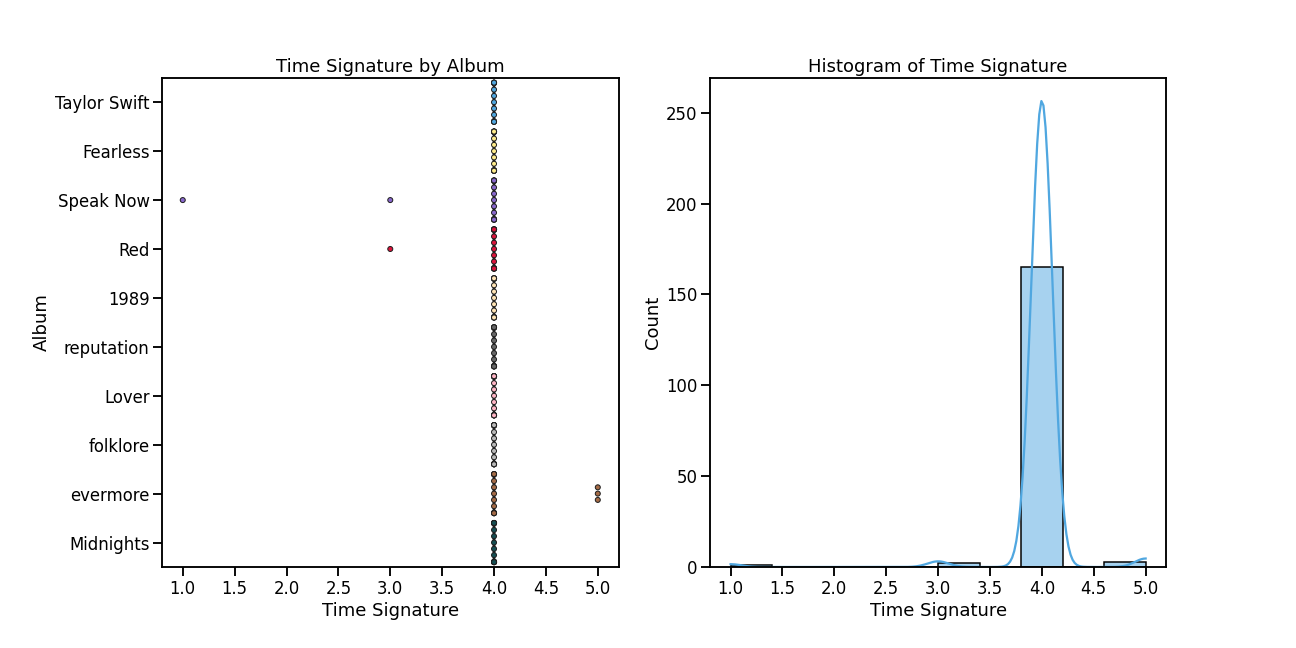
Time Signature
An estimated time signature. The time signature (meter) is a notational convention to specify how many beats are in each bar (or measure).
Almost all of Taylor Swift’s songs have a time signature of 4. The songs evermore, closure, and tolerate it have a time signature of 5 and are all from the album evermore. The songs Last Kiss, Dear John, Sad Beautiful Tragic have a time signature below 4 with values of 1, 3, and 3, respectively.
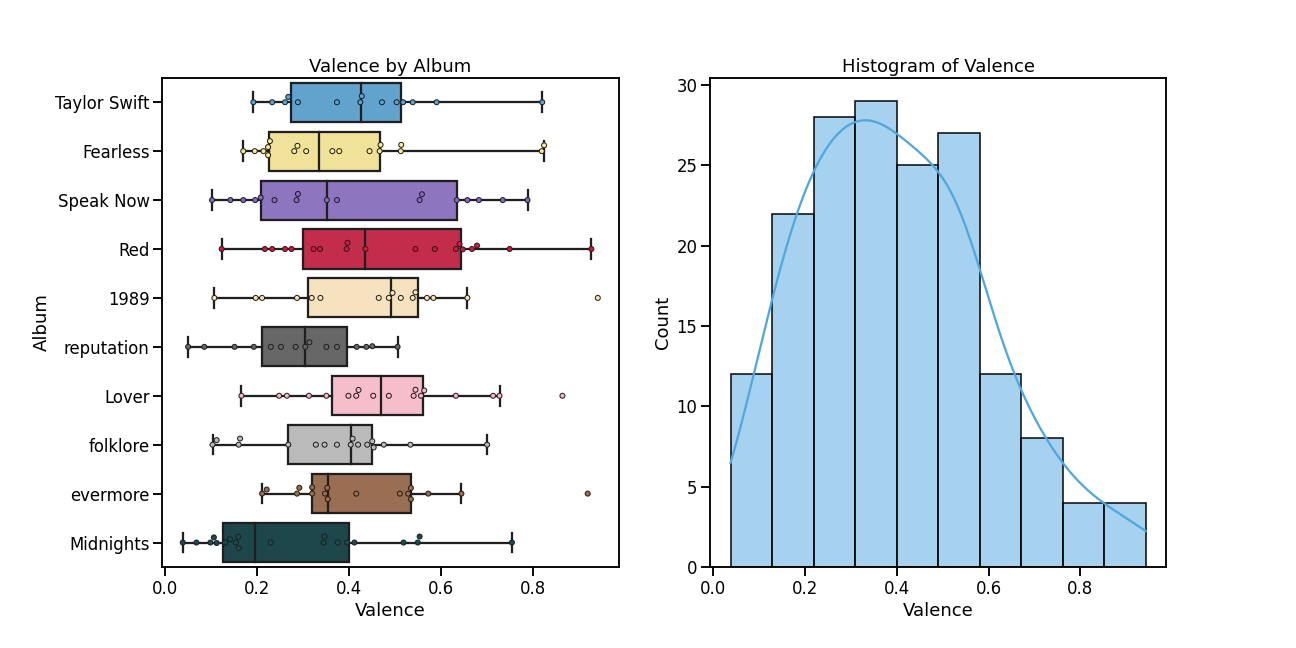
Valence
A measure from 0.0 to 1.0 describing the musical positiveness conveyed by a track. Tracks with high valence sound more positive while tracks with low valence sound more negative.
The distribution of valence is slightly right-skewed with a mean of 0.40. Her first 4 albums tend to have a similar overall valence while her later albums have a slightly lower valence with reputation and Midnights being the lowest. This makes sense as reputation was written and produced after facing public scrutiny in 2016, and Midnights explores topics of anxiety, insecurity, and self-criticism.
The top 3 most positive songs in her discography are:
- Shake It Off (0.94)
- Stay Stay Stay (0.93)
- closure (0.92)
The top 3 most negative songs are:
- Maroon (0.04)
- Delicate (0.05)
- Bigger Than The Whole Sky (0.07)
Comparing Features of Re-recordings
As for the re-recordings, I wanted to compare the average values of the album as well as individual tracks. This would have resulted in hundreds of plots and a very long document. Thus, I decided to develop a web app that would allow me to select an album or a specific song to visualize. I can focus on one plot at a time, and I would no longer have to scroll through hundreds of plots to find a specific song!
To reduce the number of plots, I decided to use a polar chart as the main visualization tool so I can include all the Spotify features in the same plot. In order to achieve this, I scaled the features to values between 0 and 1 using a MinMaxScaler.
You can open the app here and see the code on my Github here.
Fearless vs. Fearless (Taylor’s Version)
When looking at popularity, the re-recording of Fearless is a lot more popular due to it being released recently (Apr. 2021) and many fans choosing to listen to this version to show their support.
Overall, the re-recording appears to have a higher speechiness, tempo, valence, and energy. The original album has a higher danceability, length, loudness, and instrumentalness.
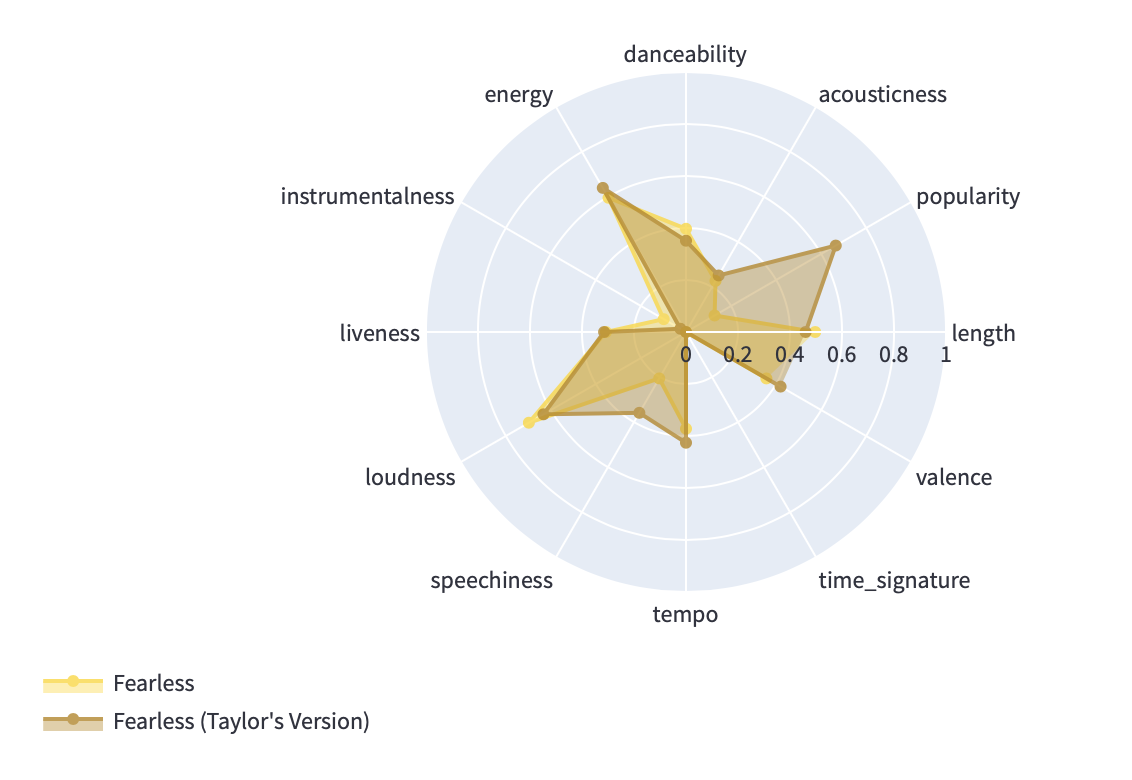
When it comes to specific songs, White Horse and Breathe showed the most difference in multiple features between the two versions while Fearless, Love Story, Hey Stephen, and You’re Not Sorry stayed mostly the same. The remaining songs are slightly different in several features or very different in one feature.
Red vs. Red (Taylor’s Version)
Like Fearless, the re-recording for Red came out recently (Nov. 2021), which explains its high popularity. For the most part, the Spotify features of the re-recording are mostly the same as the original with the original having a higher danceability and the re-recording having a higher tempo.
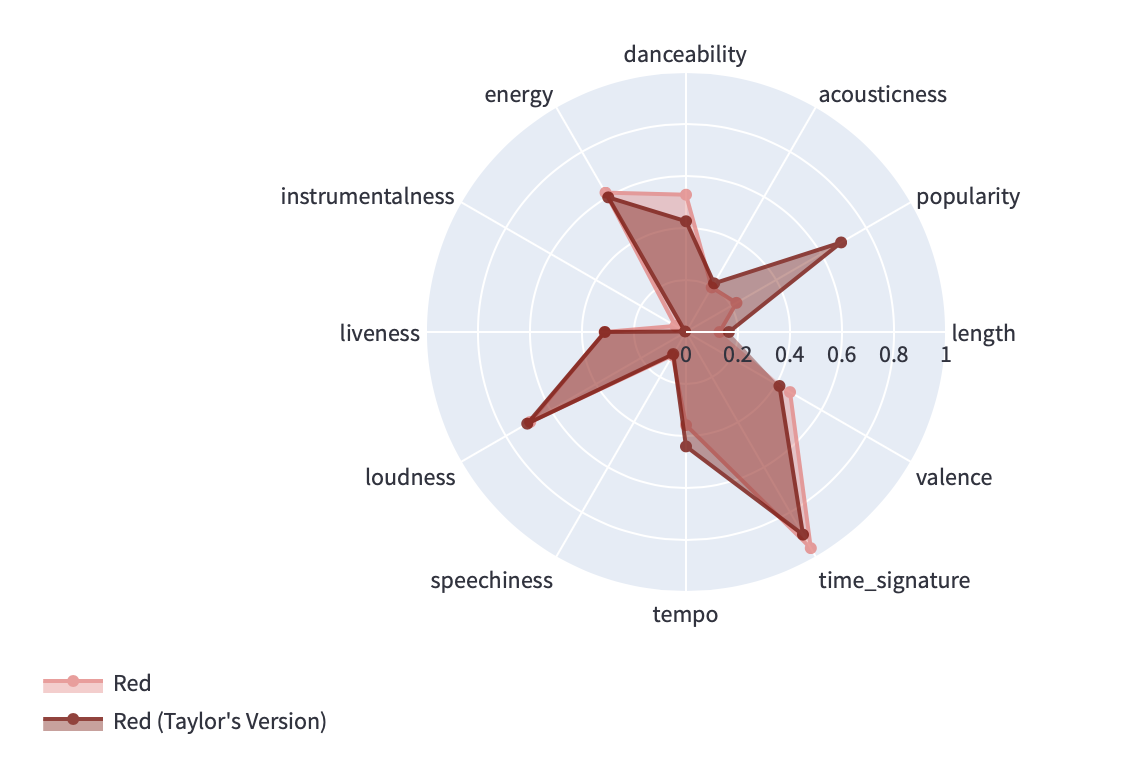
The songs All Too Well, We Are Never Ever Getting Back Together, and Ronan showed the most difference between the two versions while State of Grace, 22, The Last Time, and Holy Ground stayed mostly the same. The remaining songs are slightly different in several features or very different in one or two features.
Conclusion
As Taylor Swift is my most listened to artist, many of these results were not surprising. Her songs tend to have a longer length that decreased when she transitioned to mainstream pop music. Her earlier albums, which are under the country genre, had the highest loudness and energy while her pop albums had the highest danceability. Her newest albums, which are under the alternative genre, had the highest acousticness but the lowest danceability, energy, and loudness.
Despite this, there were some unexpected moments throughout this analysis. Her 7th album, Lover, showed the most variability in several features including danceability, acousticness, tempo, and energy. I always found this album to be as sonically cohesive as her other albums. Dress having one of the lowest valence was also surprising as it is a love song. The most surprising result was Soon You’ll Get Better having the highest tempo. I think it could be an error in the data!
As for the re-recordings, Taylor Swift’s goal was to capture the essence of the original while improving the songs in any way she saw fit. Thus, the overall features between the two versions stayed fairly the same with some minor differences. It would be interesting to know which version of the songs fans and listeners prefer to see if it correlates with a change in a specific feature.